Large wall thickness 6061T6 aluminum alloy needs to be quenched after hot extrusion. Due to the limitation of discontinuous extrusion, a part of the profile will enter the water-cooling zone with a delay. When the next short ingot is continued to be extruded, this part of the profile will undergo delayed quenching. How to deal with the delayed quenching area is an issue that every production company needs to consider. When the extrusion tail end process waste is short, the performance samples taken are sometimes qualified and sometimes unqualified. When resampling from the side, the performance is qualified again. This article gives the corresponding explanation through experiments.
1. Test materials and methods
The material used in this experiment is 6061 aluminum alloy. Its chemical composition measured by spectral analysis is as follows: It complies with GB/T 3190-1996 international 6061 aluminum alloy composition standard.
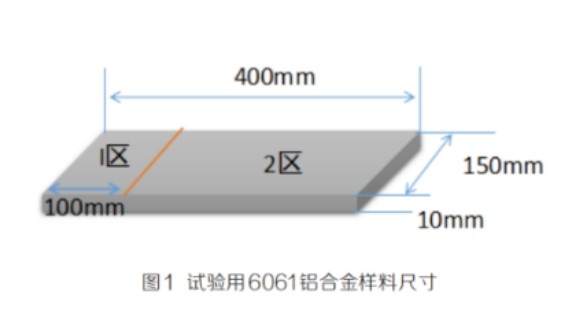
In this experiment, a part of the extruded profile was taken for solid solution treatment. The 400mm long profile was divided into two areas. Area 1 was directly water-cooled and quenched. Area 2 was cooled in the air for 90 seconds and then water-cooled. The test diagram is shown in Figure 1.
The 6061 aluminum alloy profile used in this experiment was extruded by a 4000UST extruder. The mold temperature is 500°C, the casting rod temperature is 510°C, the extrusion outlet temperature is 525°C, the extrusion speed is 2.1mm/s, high-intensity water cooling is used during the extrusion process, and a 400mm length test piece is taken from the middle of the extruded finished profile. The sample width is 150mm and the height is 10.00mm.
The taken samples were partitioned and then subjected to solution treatment again. The solution temperature was 530°C and the solution time was 4 hours. After taking them out, the samples were placed in a large water tank with a water depth of 100mm. The larger water tank can ensure that the water temperature in the water tank changes little after the sample in zone 1 is water-cooled, preventing the increase in water temperature from affecting the water cooling intensity. During the water cooling process, ensure that the water temperature is within the range of 20-25°C. The quenched samples were aged at 165°C*8h.
Take a part of the sample 400mm long 30mm wide 10mm thick, and perform a Brinell hardness test. Make 5 measurements every 10mm. Take the average value of the 5 Brinell hardnesses as the Brinell hardness result at this point, and observe the hardness change pattern.
The mechanical properties of the profile were tested, and the tensile parallel section 60mm was controlled at different positions of the 400mm sample to observe the tensile properties and fracture location.
The temperature field of the water-cooled quenching of the sample and the quenching after a delay of 90s was simulated through ANSYS software, and the cooling rates of the profiles at different positions were analyzed.
2. Experimental results and analysis
2.1 Hardness test results
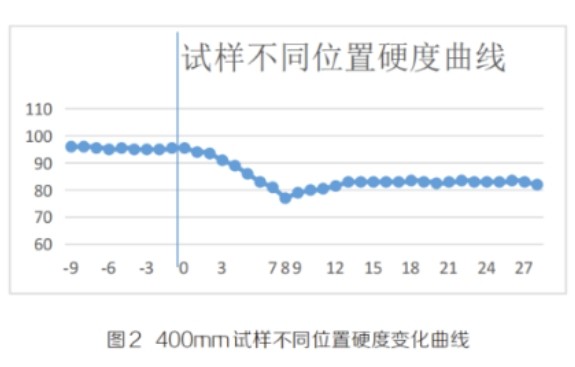
Figure 2 shows the hardness change curve of a 400mm long sample measured by a Brinell hardness tester (the unit length of the abscissa represents 10mm, and the 0 scale is the dividing line between normal quenching and delayed quenching). It can be found that the hardness at the water-cooled end is stable at around 95HB. After the dividing line between water-cooling quenching and delayed 90s water-cooling quenching, the hardness begins to decline, but the decline rate is slow in the early stage. After 40mm (89HB), the hardness drops sharply, and drops to the lowest value (77HB) at 80mm. After 80mm, the hardness did not continue to decrease, but increased to a certain extent. The increase was relatively small. After 130mm, the hardness remained unchanged at around 83HB. It can be speculated that due to the effect of heat conduction, the cooling rate of the delayed quenching part changed.
2.2 Performance test results and analysis
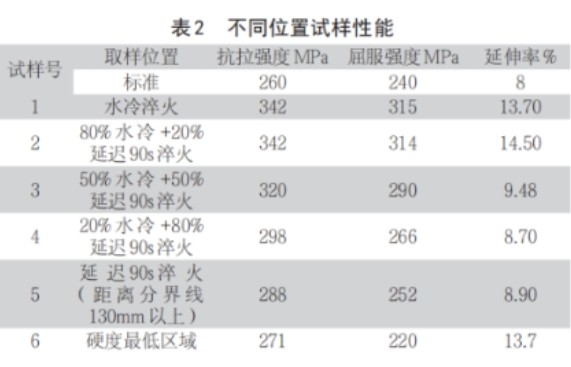
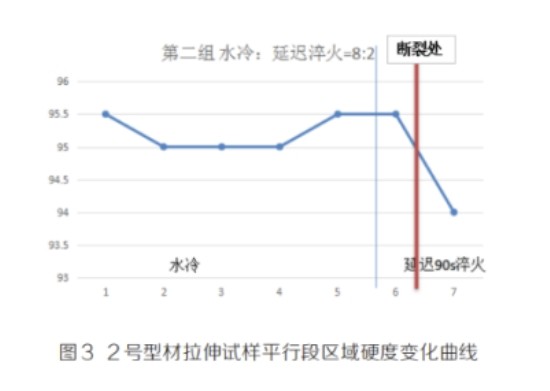
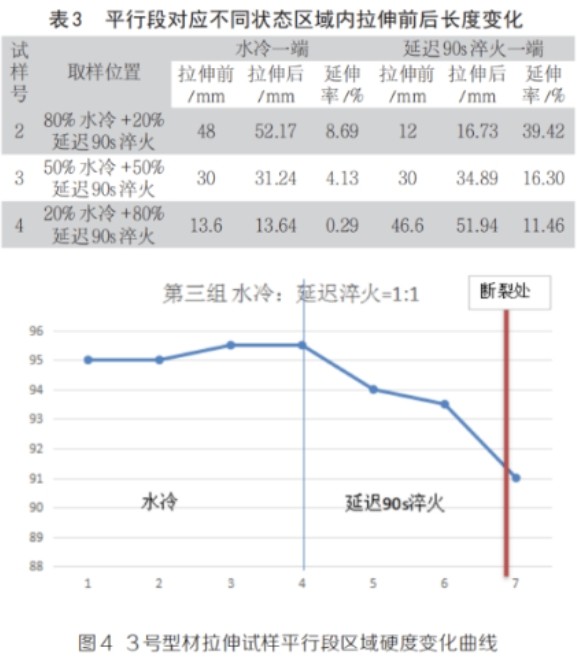
Table 2 shows the results of tensile experiments conducted on samples taken from different positions of the parallel section. It can be found that the tensile strength and yield strength of No. 1 and No. 2 have almost no change. As the proportion of delayed quenching ends increases, the tensile strength and yield strength of the alloy show a significant downward trend. However, the tensile strength at each sampling location is above the standard strength. Only in the area with the lowest hardness, the yield strength is lower than the sample standard, the sample performance is unqualified.
Figure 4 shows the tensile properties results of sample No. 3. It can be found from Figure 4 that the farther away from the dividing line, the lower the hardness of the delayed quenching end. The decrease in hardness indicates that the performance of the sample is reduced, but the hardness decreases slowly, only decreasing from 95HB to about 91HB at the end of the parallel section. As can be seen from the performance results in Table 1, the tensile strength decreased from 342MPa to 320MPa for water cooling. At the same time, it was found that the fracture point of the tensile sample is also at the end of the parallel section with the lowest hardness. This is because it is far away from the water cooling, the alloy performance is reduced, and the end reaches the tensile strength limit first to form a necking down. Finally, break from the lowest performance point, and the break position is consistent with the performance test results.
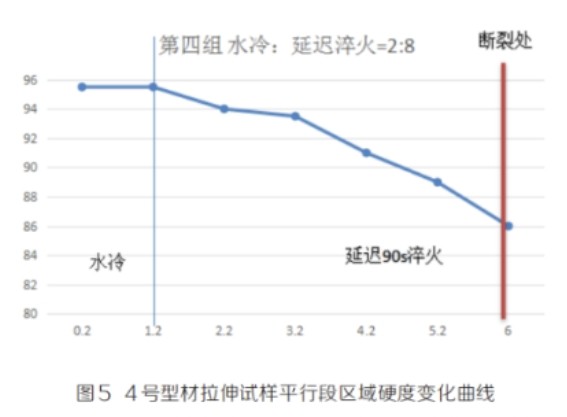
Figure 5 shows the hardness curve of the parallel section of sample No. 4 and the fracture position. It can be found that the farther away from the water-cooling dividing line, the lower the hardness of the delayed quenching end. At the same time, the fracture location is also at the end where the hardness is lowest, 86HB fractures. From Table 2, it is found that there is almost no plastic deformation at the water-cooled end. From Table 1, it is found that the sample performance (tensile strength 298MPa, yield 266MPa) is significantly reduced. The tensile strength is only 298MPa, which does not reach the yield strength of the water-cooled end (315MPa). The end has formed a necking down when it is lower than 315MPa. Before fracture, only elastic deformation occurred in the water-cooled area. As the stress disappeared, the strain at the water-cooled end disappeared. As a result, the deformation amount in the water-cooling zone in Table 2 has almost no change. The sample breaks at the end of the delayed rate fire, the deformed area is reduced, and the end hardness is the lowest, resulting in a significant reduction in performance results.
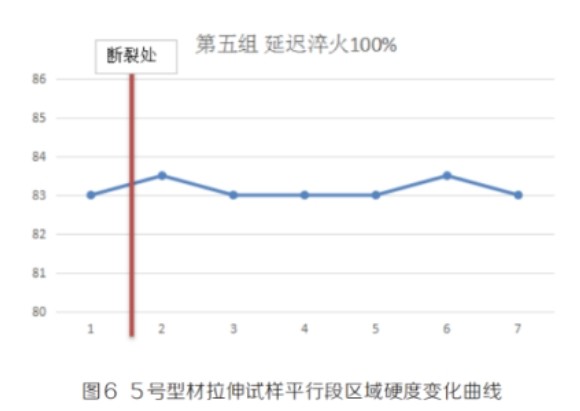
Take samples from the 100% delayed quenching area at the end of the 400mm specimen. Figure 6 shows the hardness curve. The hardness of the parallel section is reduced to about 83-84HB and is relatively stable. Due to the same process, the performance is roughly the same. No obvious pattern is found in the fracture position. The alloy performance is lower than that of the water-quenched sample.
In order to further explore the regularity of performance and fracture, the parallel section of the tensile specimen was selected near the lowest point of hardness (77HB). From Table 1, it was found that the performance was significantly reduced, and the fracture point appeared at the lowest point of hardness in Figure 2.
2.3 ANSYS analysis results
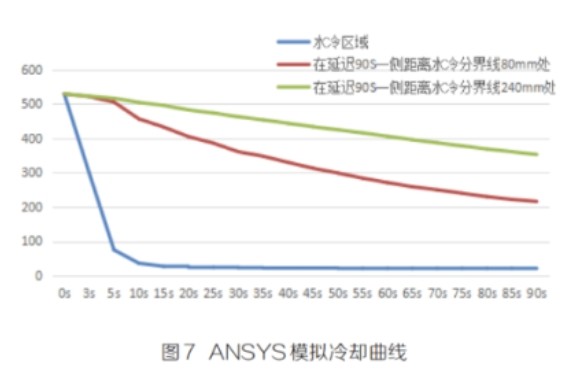
Figure 7 shows the results of ANSYS simulation of cooling curves at different positions. It can be seen that the temperature of the sample in the water-cooling area dropped rapidly. After 5s, the temperature dropped to below 100°C, and at 80mm from the dividing line, the temperature dropped to about 210°C at 90s. The average temperature drop is 3.5°C/s. After 90 seconds in the terminal air cooling area, the temperature drops to about 360°C, with an average drop rate of 1.9°C/s.
Through performance analysis and simulation results, it is found that the performance of the water-cooling area and delayed quenching area is a change pattern that first decreases and then increases slightly. Affected by water cooling near the dividing line, heat conduction causes the sample in a certain area to drop at a cooling rate less than that of water cooling (3.5°C/s). As a result, Mg2Si, which solidified into the matrix, precipitated in large quantities in this area, and the temperature dropped to about 210°C after 90 seconds. The large amount of Mg2Si precipitated led to a smaller effect of water cooling after 90 s. The amount of Mg2Si strengthening phase precipitated after aging treatment was greatly reduced, and the sample performance was subsequently reduced. However, the delayed quenching zone far away from the dividing line is less affected by water cooling heat conduction, and the alloy cools relatively slowly under air cooling conditions (cooling rate 1.9°C/s). Only a small part of the Mg2Si phase slowly precipitates, and the temperature is 360C after 90s. After water cooling, most of the Mg2Si phase is still in the matrix, and it disperses and precipitates after aging, which plays a strengthening role.
3. Conclusion
It was found through experiments that delayed quenching will cause the hardness of the delayed quenching zone at the intersection of normal quenching and delayed quenching to first decrease and then increase slightly until it finally stabilizes.
For 6061 aluminum alloy, the tensile strengths after normal quenching and delayed quenching for 90 s are 342MPa and 288MPa respectively, and the yield strengths are 315MPa and 252MPa, both of which meet the sample performance standards.
There is a region with the lowest hardness, which is reduced from 95HB to 77HB after normal quenching. The performance here is also the lowest, with a tensile strength of 271MPa and a yield strength of 220MPa.
Through ANSYS analysis, it was found that the cooling rate at the lowest performance point in the 90s delayed quenching zone decreased by approximately 3.5°C per second, resulting in insufficient solid solution of the strengthening phase Mg2Si phase. According to this article, it can be seen that the performance danger point appears in the delayed quenching area at the junction of normal quenching and delayed quenching, and is not far from the junction, which has important guiding significance for the reasonable retention of extrusion tail end process waste.
Edited by May Jiang from MAT Aluminum
Post time: Aug-28-2024


